Thursday, December 3, 2020

This Date in Weather History for December 3,2020

 Weather History

For Thursday, December 3,2020


1856 - A severe blizzard began to rage across Iowa and Kansas. It produced as much as 16 inches of snow in Iowa. (David Ludlum)
1926 - Yuma, AZ, was soaked with 1.10 inch of rain, and by the 10th of the month had received 4.43 inches, making it the wettest December of record. The average annual rainfall for Yuma is 3.38 inches. (3rd-10th) (The Weather Channel)
1983 - Birmingham, AL, was drenched with 9.22 inches of rain in 24 hours. The rains caused severe flash flooding which literally submerged traffic. (The Weather Channel)
1987 - Stormy weather in the northwestern U.S. finally began to abate, but not before Gold Beach OR was drenched with 7.94 inches of rain in 24 hours. Low pressure spread snow from the Upper Mississippi Valley to the Central Appalachians. (Storm Data) (The National Weather Summary)
1988 - Gale force winds ushered cold air into the northeastern U.S., and produced snow squalls in the Lower Great Lakes Region. Winds gusted to 48 mph at Buffalo NY. (The National Weather Summary) (Storm Data)
1989 - Heavy snow and high winds created blizzard conditions in northern New England. Snowfall totals in Maine ranged up to 31 inches, at Limestone. Presque Isle ME reported a record 30 inches of snow in 24 hours, along with wind gusts to 46 mph. (The National Weather Summary) (Storm Data)

Wednesday, December 2, 2020

Santa Ana Winds Prompt 'Particularly Dangerous Situation' Wildfire Alert in Southern California

 Chris Dolce

Published: December 2, 2020


A prolonged bout of Santa Ana winds in Southern California is triggering another critically high wildfire danger amid tinder-dry conditions.

Periods of strong wind gusts are expected to last into at least Friday or Saturday in portions of Southern California. If any wildfires ignite the winds could allow them to spread rapidly through an environment that also has very dry vegetation and low humidity.

(MORE: Fire Danger Could Trigger Preventive Power Outages)

The National Weather Service (NWS) called this a "particularly dangerous situation" for the Los Angeles and Ventura County mountains and the Santa Clarita Valley. Thursday is expected to have the most severe wildfire danger in this area, the NWS said.

Red flags warnings for the fire danger have been issued by the NWS for most of Southern California. They go into effect late Wednesday and last into Friday or even Saturday in some areas.

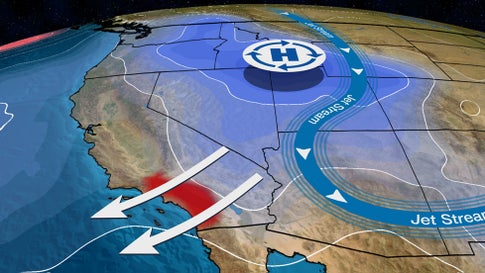
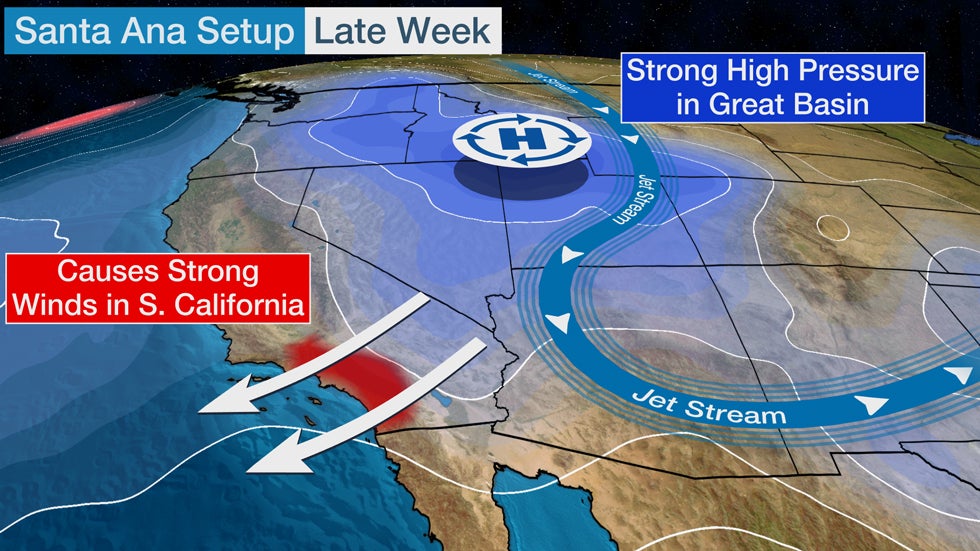
Santa Ana winds happen when an area of surface high pressure builds into the Great Basin and creates a large, anomalous pressure difference between the inland high and lower pressure near or off the coast.

The strength of the winds can be amplified when there is a southward plunge of the jet stream over the Southwest, as we are seeing late this week.

Santa Ana winds are most common from October through March, according to a 2017 climatology study, but can occur anytime from September into June.

The wildfire danger fueled by strong winds is typically highest in fall as the region emerges from the summer dry season when vegetation is driest.

Wildfire danger is often substantially reduced after the first significant rain and mountain snow event of the late fall and early winter arrives. That hasn't happened yet.

Since Oct. 1, rainfall in downtown Los Angeles is just 6% of average, or near a tenth of an inch. December, on average, is when the wintertime wet season ramps up substantially in Los Angeles and the rest of Southern California.

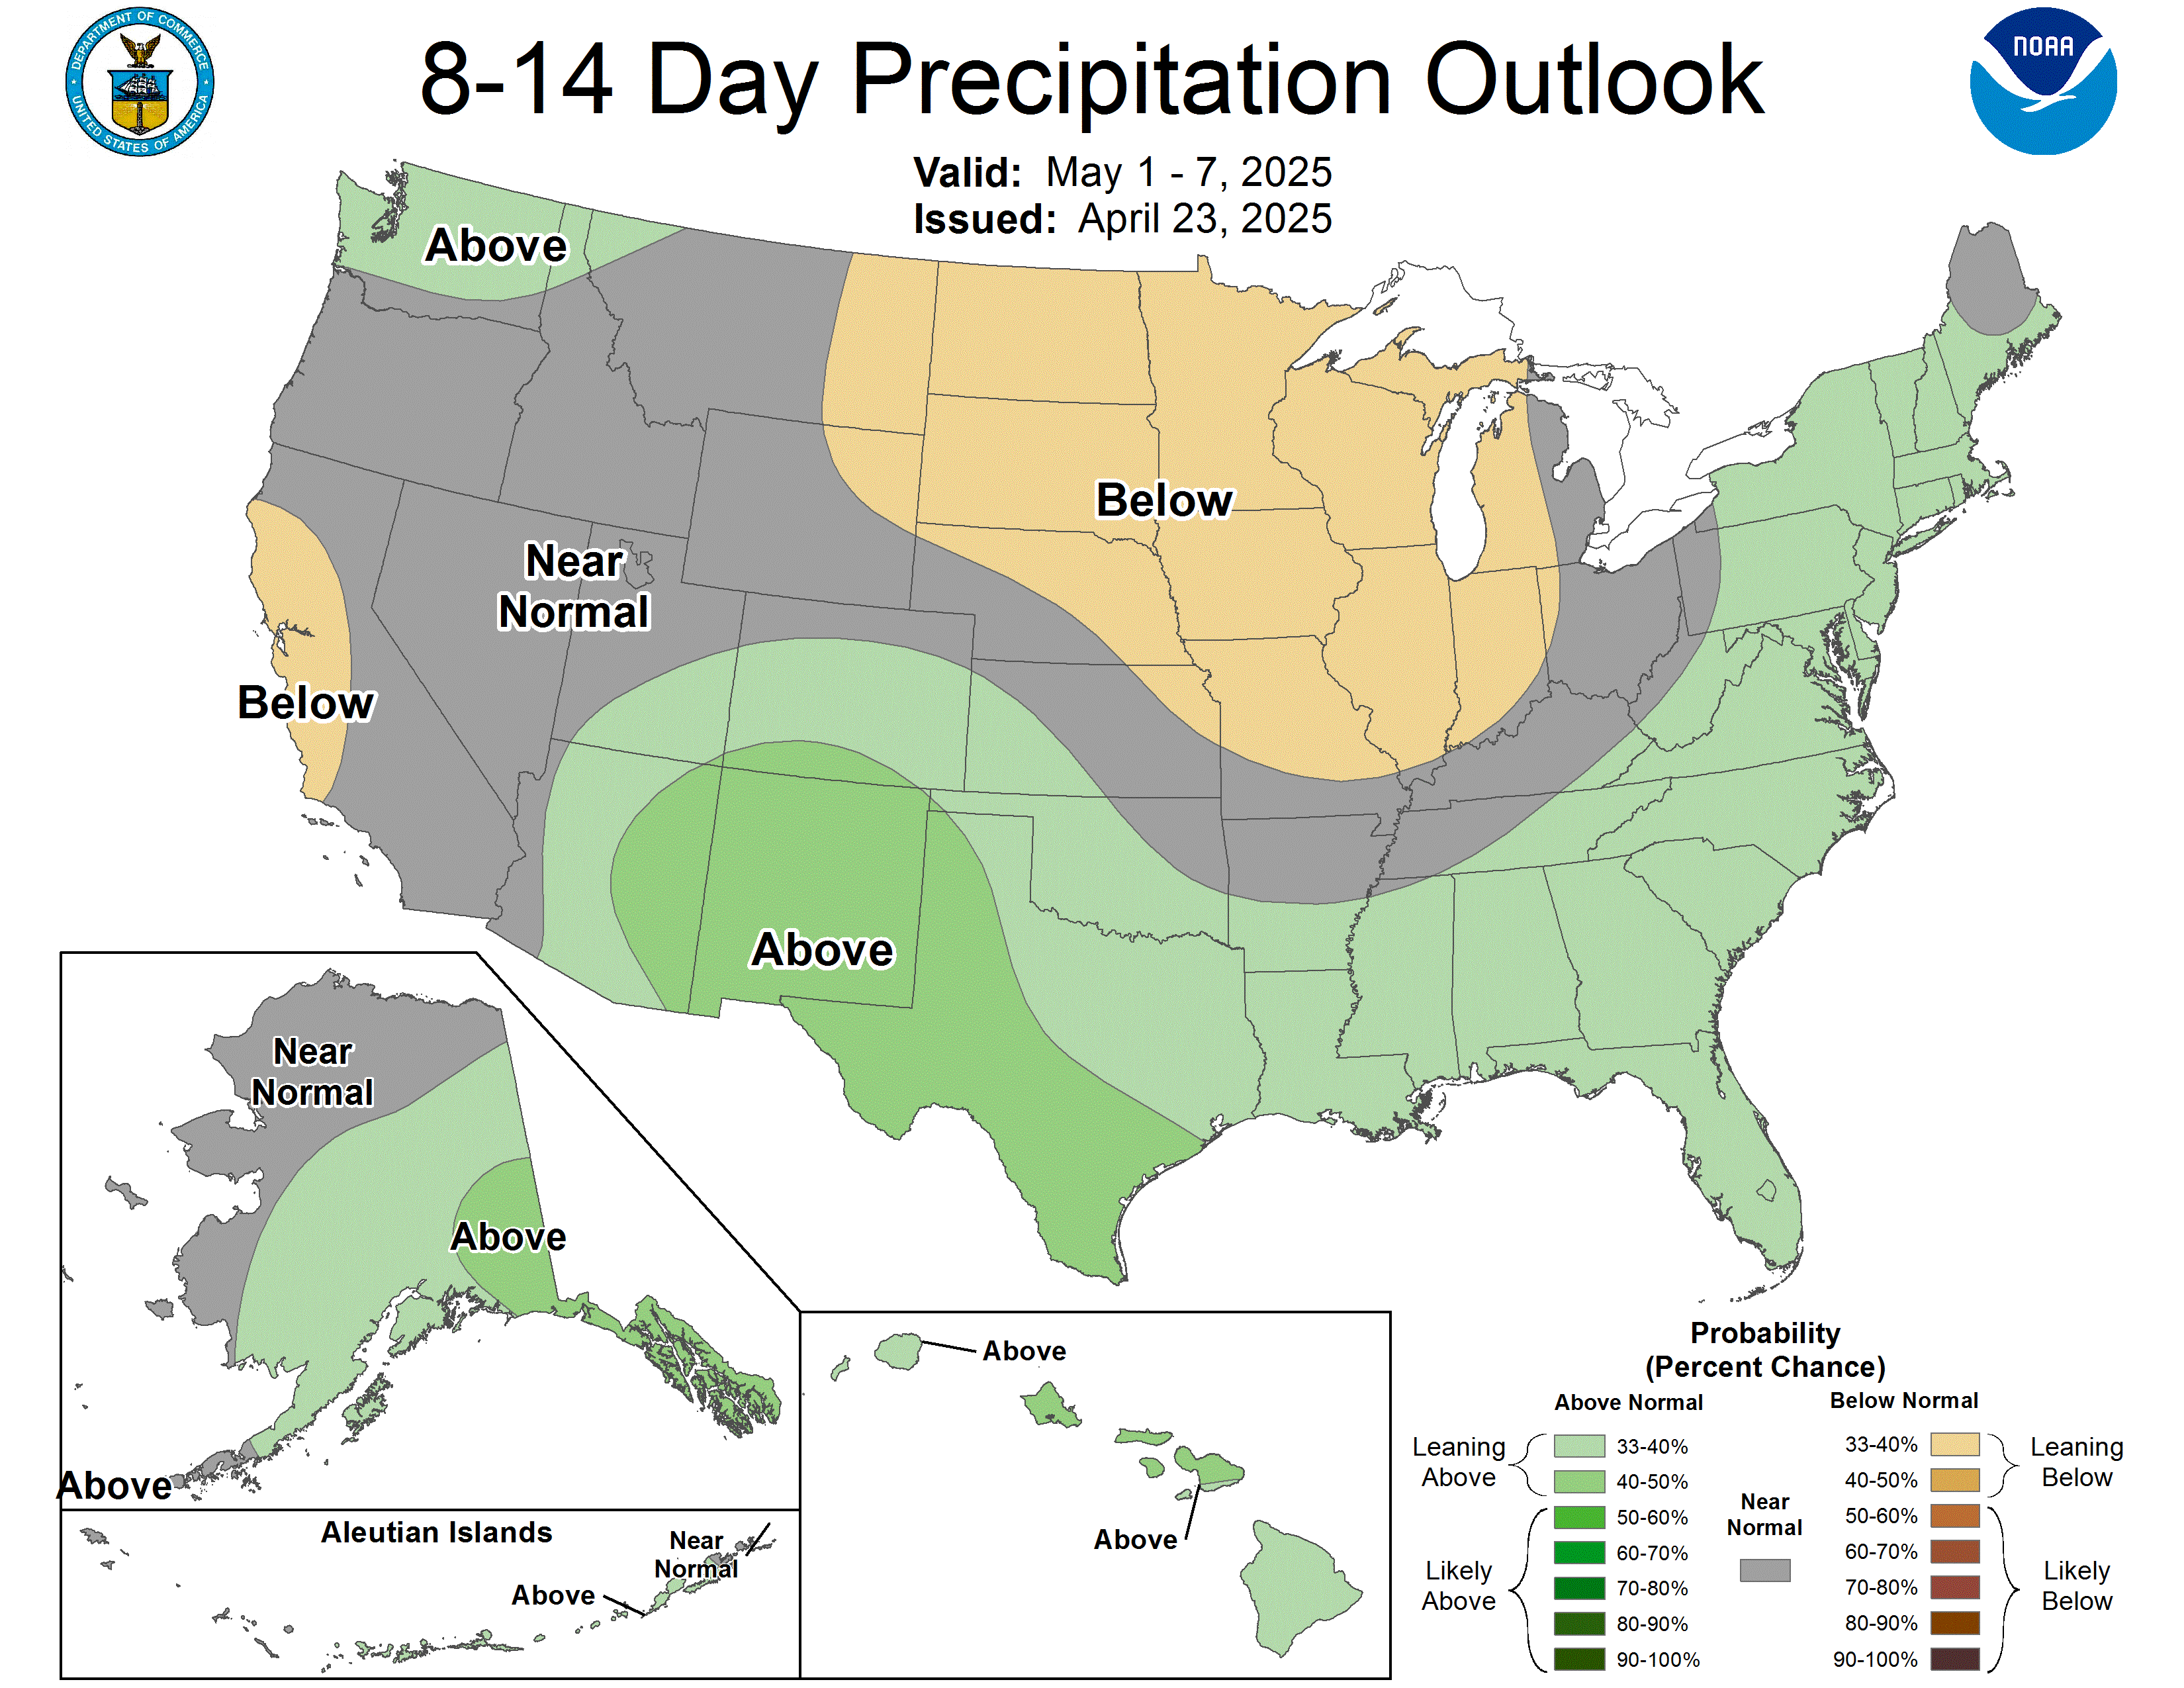
However, the chance of significant rainfall or mountain snow is expected to be slim into mid-December. Odds are tilted toward below-average precipitation in much of California through mid-December, according to the latest 8- to 14-day outlook from NOAA's Climate Prediction Center.

Any additional rounds of strong winds in Southern California will heighten wildfire danger until a weather pattern change opens the door for substantial precipitation to arrive in the region.

The Weather Company’s primary journalistic mission is to report on breaking weather news, the environment and the importance of science to our lives. This story does not necessarily represent the position of our parent company, IBM.

The Weather Company’s primary journalistic mission is to report on breaking weather news, the environment and the importance of science to our lives. This story does not necessarily represent the position of our parent company, IBM.


Weekend East Coast Storm May Bring Rain, Wind and Snow to Northeast, Appalachians

 Jonathan Erdman

Published: December 2, 2020


Another East Coast storm is increasingly likely to develop this weekend, bringing more rain, wind and snow to parts of the Northeast and Appalachians just hit by a storm early this week.

Similar to the storm affecting the East earlier this week, named Winter Storm Dane by The Weather Channel, this weekend Eastern storm is expected to develop from the teaming up of energy from two jet streams.

But it's not that simple.

There are typical uncertainties with the the track of the low-pressure system along or near the East Coast, how fast it moves, how intense it gets, and how much cold air will be available.

All those uncertainties affect who gets rain, who gets snow, how much of each, and how strong winds may become.

For now, we'll lay out our best outlook, but check back frequently for updates over the next few days as the forecast becomes clearer.

Friday

Rain and a few thunderstorms are possible in the Southeast Friday.

Some precipitation along the northern fringe associated with a cold front may fall as snow in parts of the Northeast and eastern Great Lakes.

Friday Night's Forecast

Saturday

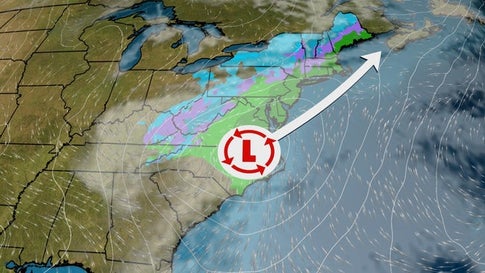
By Saturday, the majority of computer models suggest low pressure will have developed somewhere near the East Coast.

As mentioned earlier, the exact track and intensity of the low will be crucial for determining any impacts. That includes where the rain-snow line will set up and the strength of winds this system might produce.

For now, the best chance of snow Saturday stretches from parts of the Appalachians into the interior Northeast.

Closer to the Interstate 95 Northeast urban corridor, precipitation may fall mostly as rain Saturday and Saturday night. However, depending on the track of the low, some of this rain may change to wet snow in southern New England and the lower Hudson Valley Saturday night.

(MORE: Northeast Urban Corridor 'High-Impact Snowstorm' Drought Enters Third Winter)

Saturday's Forecast

Sunday

By Sunday morning, most computer models suggest low pressure will be spinning somewhere near or over New England.

Assuming that happens, the best chance of accumulating snow Sunday and Sunday night is over the interior Northeast, from upstate New York into northern New England.

Sunday's Outlook

Snow, Rain, Wind Potential

While it's still too soon to hone in on precise snow – and rain – total forecasts in the Northeast, the majority of computer forecast model guidance suggests the best chance of accumulating snow from this system will be in the interior Northeast from the Appalachians to northern New England.

Primarily rain is expected along the Interstate 95 corridor from New York City to Washington D.C.

Precipitation in southern New England should start as rain, but could change to wet snow, with some accumulation possible.

(MORE: Northeast High-Impact Snowstorm Drought Enters Third Winter)

Rain, Snow Outlook

If the low-pressure system becomes strong, some high wind gusts are possible, particularly near the coast of New England.

The Weather Company’s primary journalistic mission is to report on breaking weather news, the environment and the importance of science to our lives. This story does not necessarily represent the position of our parent company, IBM.

The Weather Company’s primary journalistic mission is to report on breaking weather news, the environment and the importance of science to our lives. This story does not necessarily represent the position of our parent company, IBM.

Atmospheric River Smashes Alaskan Capital’s 24-Hour Rain Record

 Jonathan Erdman

Published: December 2, 2020
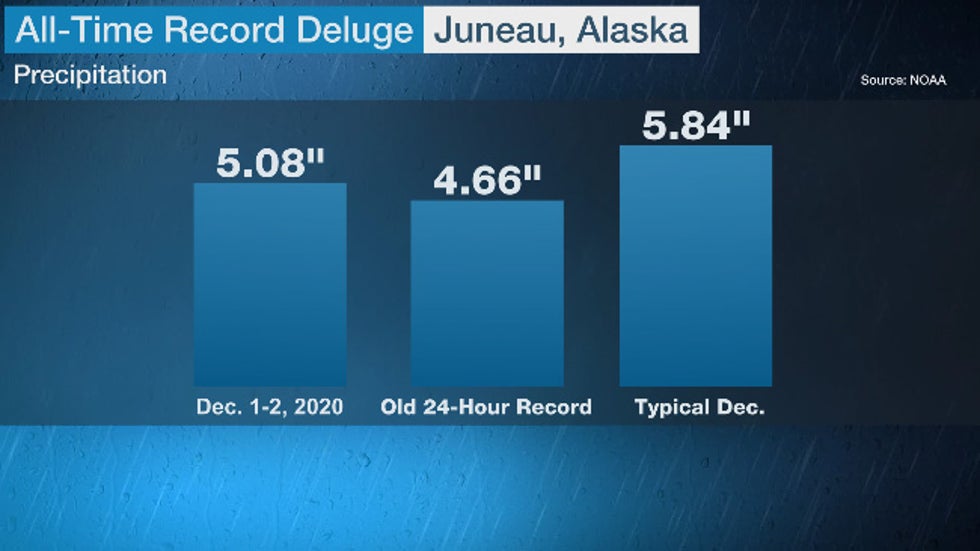
Juneau, Alaska's record-setting 24-hour rainfall, compared to the previous 24-hour record and the average precipitation for the entire month of December.

Juneau, Alaska, smashed its all-time 24-hour rainfall record Tuesday and Wednesday, triggering destructive flooding and mudslides from an atmospheric river.

Juneau picked up 5.08 inches of rain in 24 hours ending 3 a.m. Wednesday, topping the previous record for any 24-hour period in Alaska's capital city, 4.66 inches on Oct. 9-10, 1946, according to Rick Thoman, a climate specialist at the University of Alaska-Fairbanks.

Two other towns, Pelican (9.75 inches) and Skagway (5.37 inches), also set new all-time calendar-day rainfall records, according to Alaska-based climatologist Brian Brettschneider.

This torrential rain triggered flooding and mudslides in parts of the city, particularly in the neighborhoods northwest of downtown near the Mendenhall Valley and Juneau International Airport.

One mudslide damaged a home in the Salmon Creek neighborhood. Another mudslide less than a mile away threatened a city park, KTOO-TV reported.

Jordan Creek in the Mendenhall Valley was pushed to its highest level in at least eight years Tuesday – above the level the National Weather Service said would result in flooding of homes and businesses in the Jordan Square area. As a result, roads and parking lots were flooded.

Local officials warned of high avalanche danger due to the heavy rain, particularly along Thane Road southeast of downtown, where the season's first avalanche occurred Tuesday.

Multiple landslides isolated the town of Hyder, about 230 miles southeast of Juneau, from its closest town, Stewart, British Columbia. Power has been out for two days, according to the NWS in Juneau.

A mudslide closed the only road out of Haines, about 75 miles north-northwest of Juneau, on Wednesday, cutting off access to the town's airport and ferry terminal. Haines also shattered its all-time one-day and two-day rainfall records, according to the National Weather Service.

A Record Soaking, Even For Southeast Alaska

Southeast Alaska is one of the wettest locations in the U.S.

In an average year, measurable precipitation falls three out of every five days in Juneau. The town of Yakutat, Alaska, averages a whopping 155 inches of precipitation per year, over three times that of Houston.

So what made this event a record-breaker?

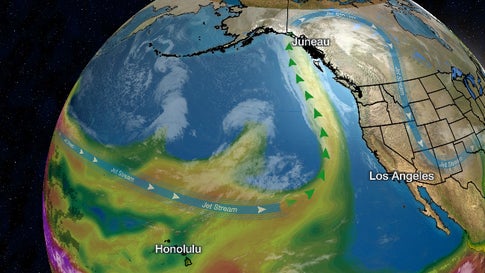
The Pacific jet stream, which typically guides storms from west to east across the Pacific Ocean this time of year, ran into a roadblock in the form of a ridge of high pressure over the U.S. West Coast.

That forced the jet stream to buckle northward, tapping a plume of deep moisture known as an atmospheric river and channeling it into southeastern Alaska.
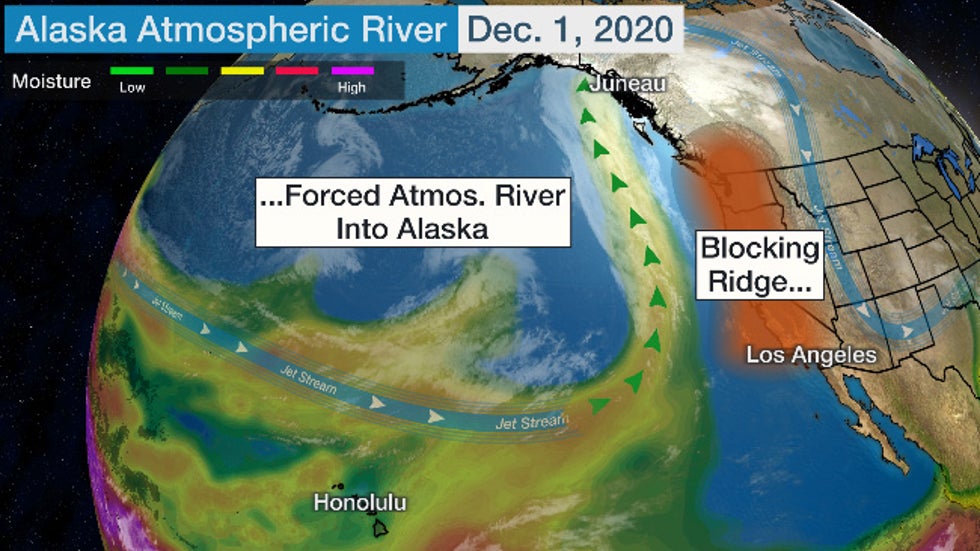
The setup for the Dec. 1-2 heavy rain event was an atmospheric river pumped northward into southeastern Alaska.

But it wasn't simply the atmospheric river.

"This type of setup with these atmospheric rivers impact the panhandle quite often," NWS meteorologist Caleb Cravens told KRBD Radio. "But what makes this one stand out is the rainfall rates that we are getting."

This deluge followed the fifth-wettest November on record in Ketchikan, Alaska, one of southeastern Alaska's wettest towns and home to the famous liquid sunshine (rain) gauge.

In 2019, southeastern Alaska was one of the few areas of the U.S. in severe to extreme drought, a drought that didn't end until mid-January 2020.

The Weather Company’s primary journalistic mission is to report on breaking weather news, the environment and the importance of science to our lives. This story does not necessarily represent the position of our parent company, IBM.
The Weather Company’s primary journalistic mission is to report on breaking weather news, the environment and the importance of science to our lives. This story does not necessarily represent the position of our parent company, IBM.

New NWS Winter Storm Severity Index Tells How Disruptive a Storm Could Be For You

 Linda Lam

Published: December 2, 2020
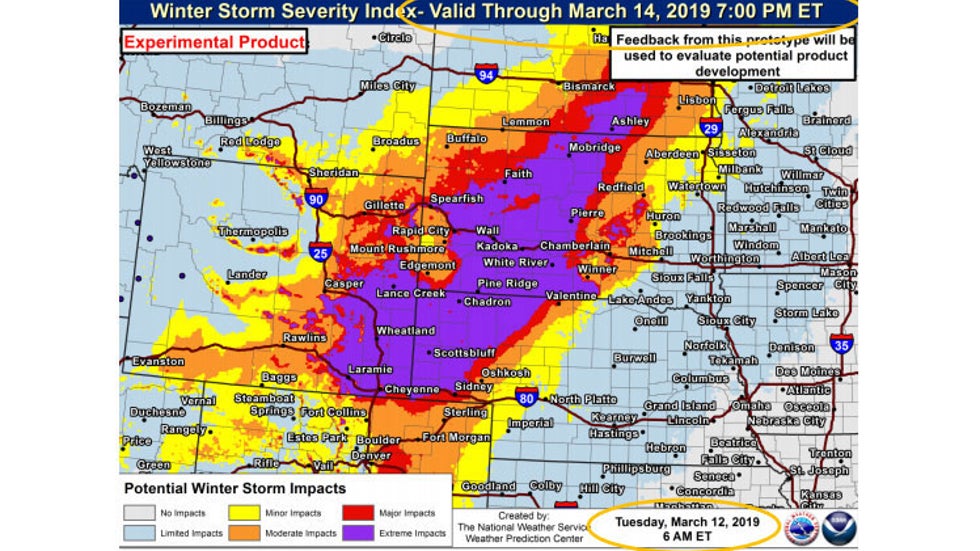
An example of what the Winter Storm Severity Index looked like for the Plains for a winter storm in March 2019.

Get ready to see a new forecasting tool from the National Weather Service (NWS) this winter.

The Winter Storm Severity Index is a new operational tool developed by the NWS to better communicate the significance of any impacts from a particular system.

Determining exactly what a winter storm forecast means for disruptions to daily activities and travel can be difficult, but this newly operational index will likely make it easier to make decisions by taking the guesswork out of what the forecast for snow, ice and wind means for a given winter storm. It also pulls together all of the individual weather factors into one piece of information.

The index takes into account conditions that can change how significant a winter weather event is in a particular area and solves the common misconception that a storm's severity is determined just by snow totals. For instance, in some situations, the greatest threat can be from ice or wind.

The NWS notes that the Winter Storm Severity Index (WSSI) is not an exact forecast for specific impacts and is not meant to be the sole source of information about a winter storm. It also only takes into account forecast information and not conditions that occurred prior to the index being issued. This means that during an ongoing winter storm the WSSI will not be representative of the entire event.

(MORE: 5 Extreme Weather Patterns to Watch For During the Winter)

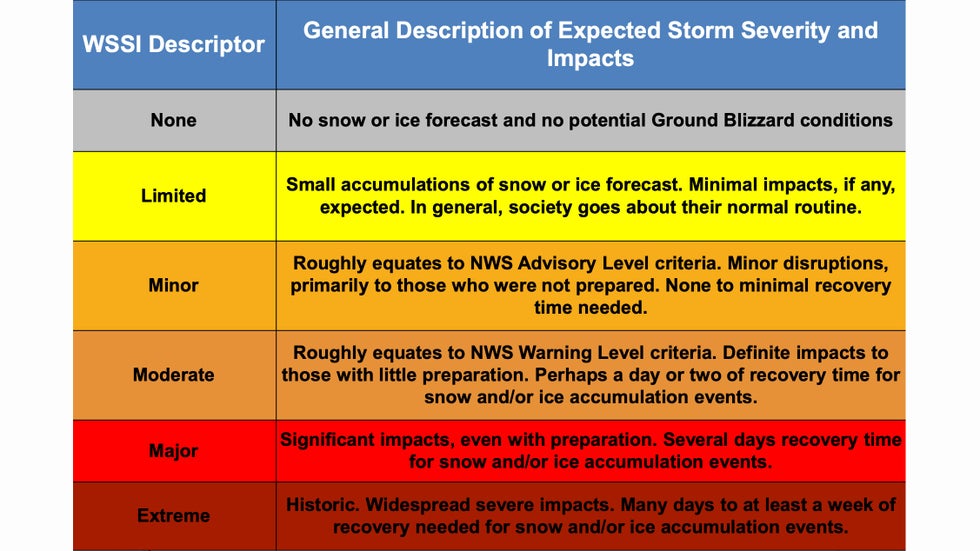
Winter Storm Severity Index scale descriptions

There are five levels of severity for potential impacts: limited, minor, moderate, major and extreme. Limited impacts represent little inconveniences, while the extreme category is reserved for severe disruptions to daily life. Extreme storms should be rare.

The WSSI looks at several aspects of snowfall, including totals, rates and water content (heavy, wet snow versus light, fluffy snow). The index also considers winds, which can lead to blowing snow or a ground blizzard. It also looks at how much ice accumulation is anticipated and whether temperatures will rapidly fall during or just after precipitation. All of these aspects suggest where damage to trees and powerlines is a greater concern. The WSSI also takes into account population density and location (climatology), which can exacerbate impacts.

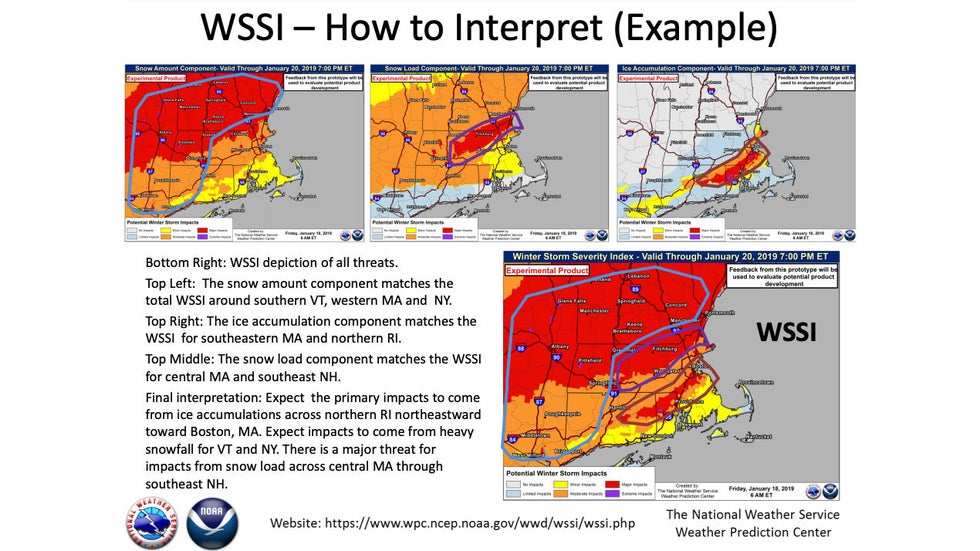
The image above gives an example of what the index looks like. The top three images show where different pieces of the index (snowfall totals, how heavy will the snow be, and ice) will be the most concerning. Those parts come together to form the WSSI index rating for each area, shown in the bottom image. The highest level in a given location is what the overall WSSI shows.

There are some limitations to the WSSI. It provides a 72-hour outlook and does not indicate when the winter weather will occur. This index is not intended to replace other forecast products, including winter storm warnings, winter weather advisories and specific hourly or daily forecasts.

The NWS introduced this tool on an experimental basis in 2018, and after feedback from inside and outside the NWS, it is now an official tool.

This index will continue to change and improve and may eventually cover a period longer than 72 hours.

There could also be an opportunity to adjust the index for local experiences, but the WSSI is a great step in the right direction to better communicate how significant a winter storm may be and what aspects of the system are the most concerning for a particular area.

The Weather Company’s primary journalistic mission is to report on breaking weather news, the environment and the importance of science to our lives. This story does not necessarily represent the position of our parent company, IBM.

The Weather Company’s primary journalistic mission is to report on breaking weather news, the environment and the importance of science to our lives. This story does not necessarily represent the position of our parent company, IBM.

California Fire Threat Could Leave Hundreds of Thousands Without Power

Jan Wesner Childs

Published: December 2, 2020
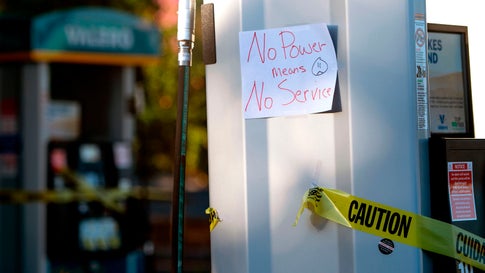
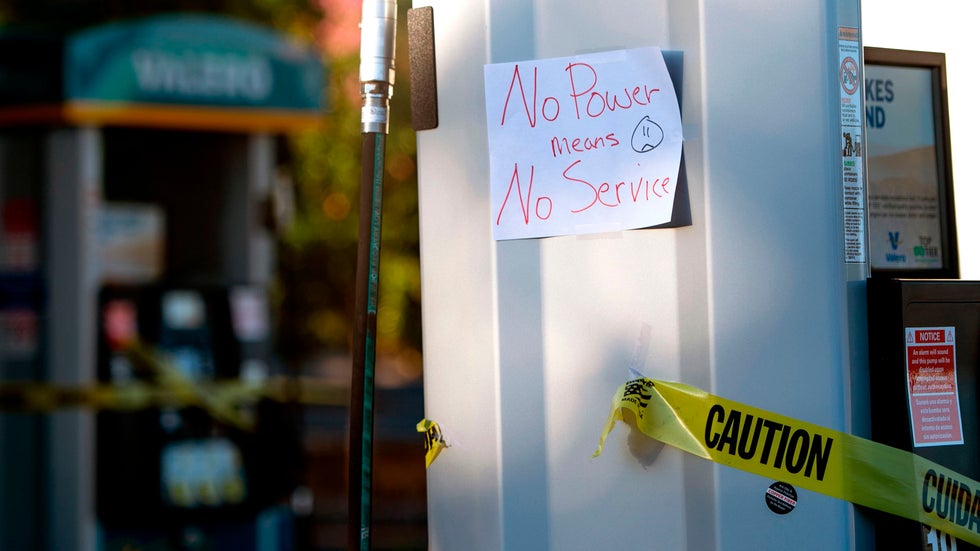
In this file photo, a Valero gas station sits vacant after power was shut down as part of a statewide blackout in Santa Rosa, California, last year. Utility providers in Southern California say more than 300,000 homes and businesses could be without electricity in the coming days due to dangerous fire weather.

Electricity could be cut to more than 300,000 homes and businesses in Southern California as dangerous fire weather moves in Wednesday night.

Utility provider Southern California Edison is warning about 270,000 customers across eight counties that their power could be shut off between Thursday and Saturday. The public safety power shutoffs, designed to prevent power lines and other infrastructure from sparking wildfires, could affect more than 77,000 customers in Ventura County, 67,000 in Riverside County and 59,000 in San Bernardino County, the company said in a news release.

Other counties under consideration for outages include Los Angeles, Kern, Orange, San Diego and Tulare. In all, about 5% of SoCal Edison's customers could see their power shut off.

Another company, San Diego Gas & Electric, said more than 88,000 of its customers could lose power. Those outages could start as early as Wednesday night and last through Sunday or Monday, according to a news release.

(MORE: Santa Ana Winds Stoke California Fire Danger)

The danger is being driven by what is expected to be a prolonged Santa Ana wind event, combined with extremely dry conditions.

“Because there hasn’t been any substantial rain, the vegetation is tinder dry," weather.com meteorologist Chris Dolce said Wednesday morning.

The National Weather Service in Los Angeles is warning of a long duration of very critical fire danger Wednesday night through Saturday, and notes that any fires that start could grow rapidly. Red flag and high wind warnings are in effect for much of the region.

Winds could gust as high as 55 mph in valley and coastal areas and up to 70 mph in mountain regions, according to the NWS. Drivers of high profile vehicles are advised to use caution.

Last week, SoCal Edison cut off power to some residents in the same areas due to a fire threat over the Thanksgiving holiday.

“We understand that having your power turned off is a hardship, especially in the middle of a pandemic and when most folks are at home. We are working to limit the number of customers who are shut off due to Public Safety Power Shutoffs,” said Vik Trehan, SCE director and incident commander.

“We know this is especially difficult for customers who lost power due to PSPS over the Thanksgiving holiday and who live in areas with high winds and increased wildfire threats. These PSPS are initiated to reduce the risk of wildfires and to protect communities from wildfire danger.”

California has endured a historic series of fires this year, with nearly 9,300 wildfires that burned more than 4.1 million acres and damaged or destroyed 10,488 homes and other buildings, according to Cal Fire. Thirty-one people have been killed.

The Weather Company’s primary journalistic mission is to report on breaking weather news, the environment and the importance of science to our lives. This story does not necessarily represent the position of our parent company, IBM.

The Weather Company’s primary journalistic mission is to report on breaking weather news, the environment and the importance of science to our lives. This story does not necessarily represent the position of our parent company, IBM.


This Date in Weather History for December 2,2020

 Weather History

For Wednesday, December 2,2020


1896 - An early season snow and ice storm struck the southeastern U.S. It produced 11 inches of snow at Charlotte NC, and six inches at Atlanta GA. (David Ludlum)
1925 - A late season hurricane caused extensive damage across the Florida peninsula, then moved off the Georgia coast crossing Cape Hatteras as a tropical storm. The storm produced whole gales along the Middle Atlantic and Southern New England coast. Winds gusted to 60 mph at Block Island RI, and reached 64 mph at Atlantic City NJ. (David Ludlum)
1950 - A late season tornado killed four persons in Madison County and Bond County, east of St Louis MO. Three tornadoes touched down in Illinois that afternoon, compared to just half a dozen tornadoes in the month of December in 115 years of records up until that time. Thunderstorms also produced hail which caused more than four million dollars damage in the St Louis area, it was the most damaging hailstorm of record for Missouri. (David Ludlum) (The Weather Channel)
1970 - A tornado, 400 yards in width, touched down about one mile below the summit of Timpanogos Divide. Trees up to 18 inches in diameter were snapped, and some of the 38 inch snow cover was carried 1000 feet above the ground as the tornado traveled one mile. (The Weather Channel)
1982 - A tornado destroyed a home four miles south of Eastwood MO. The owners were not injured in that tornado, but ironically one was killed Christmas Eve when another tornado hit the replacement mobile home on the same site. (The Weather Channel)
1987 - A powerful storm over the Gulf of Alaska continued to produced high winds and heavy rain along the northern and central Pacific coast. Winds gusted to 80 mph south of Port Orford OR, Stevens Pass WA was blanketed with sixteen inches of snow, and Blue Canyon CA was soaked with 1.63 inches of rain. (Storm Data) (The National Weather Summary)
1988 - Squalls in the Great Lakes Region produced ten inches of snow at Union City, PA. Gale force winds gusted to 55 mph at Buffalo NY. (The National Weather Summary) (Storm Data)
1989 - Squalls produced heavy snow in the Great Lakes Region. Totals in Upper Michigan ranged up to 20 inches at Ironwood. Heavy snow and high winds caused 150 auto accidents in Michigan, resulting in sixteen deaths and 22 injuries. Strong northwesterly winds gusted to 73 mph at Johnstown PA, and Lowville PA received 20 inches of snow in 36 hours. (The National Weather Summary) (Storm Data)

Man missing at sea for nearly 2 weeks found alive in life raft off Washington coast

  One of two men missing at sea for nearly two weeks was found alive on Thursday by a Canadian fishing boat in a life raft in Canadian water...