Published: April 6,2020

Tropical Cyclone Harold underwent a last-minute burst of intensification before it hit Vanuatu and eventually even strengthened into the equivalent of Category 5 hurricane as it began to move away from the country.
The first colorized infrared satellite animation above shows Harold becoming much better organized in the hours before it made landfall on Espiritu Santo Island, where nearly 40,000 people live.
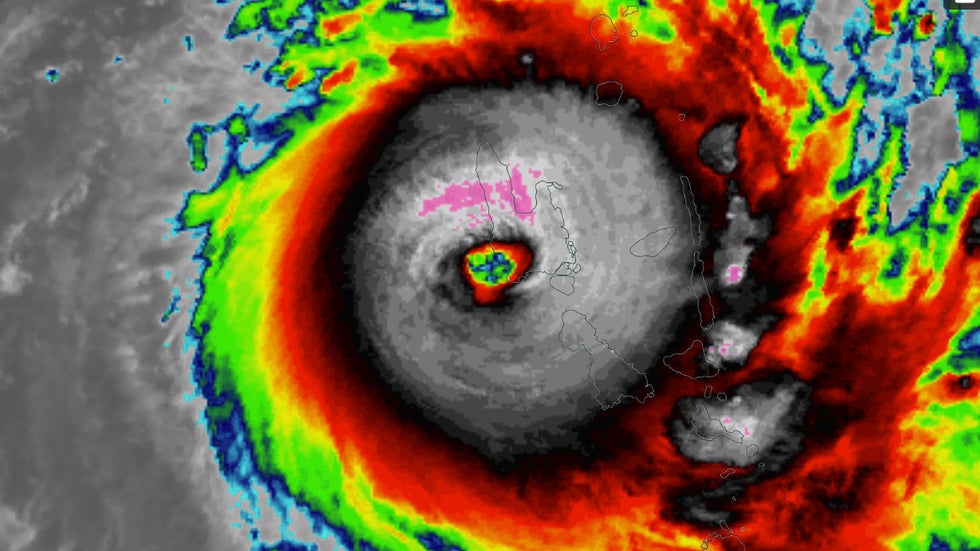
Below is a closer view of Harold's eye when it was making landfall on Espiritu Santo. Maximum sustained winds at the time were estimated to be 145 mph, or equivalent in strength to a strong Category 4 hurricane, according to the Joint Typhoon Warning Center (JTWC).
The gray and purple shadings surrounding the eye represent higher clouds tops, indicative of the most intense convection (rain and thunderstorms) in the tropical cyclone.
Click the play button below to view Harold's landfall using visible satellite imagery. This type of satellite view shows how the tropical cyclone would look if you were in space viewing it with your naked eye.


Espiritu Santo's mountainous terrain, which rises to nearly 6,100 feet in elevation, caused Harold to weaken some as it passed over the island. But once Harold's core emerged back over water it strengthened again.
The satellite loop below shows Harold's eyewall becoming better defined as it raked across Vanuatu's Pentecost Island, where more than 16,000 people live. The JTWC estimated Harold's maximum sustained winds to be 155 mph when it hit the island.

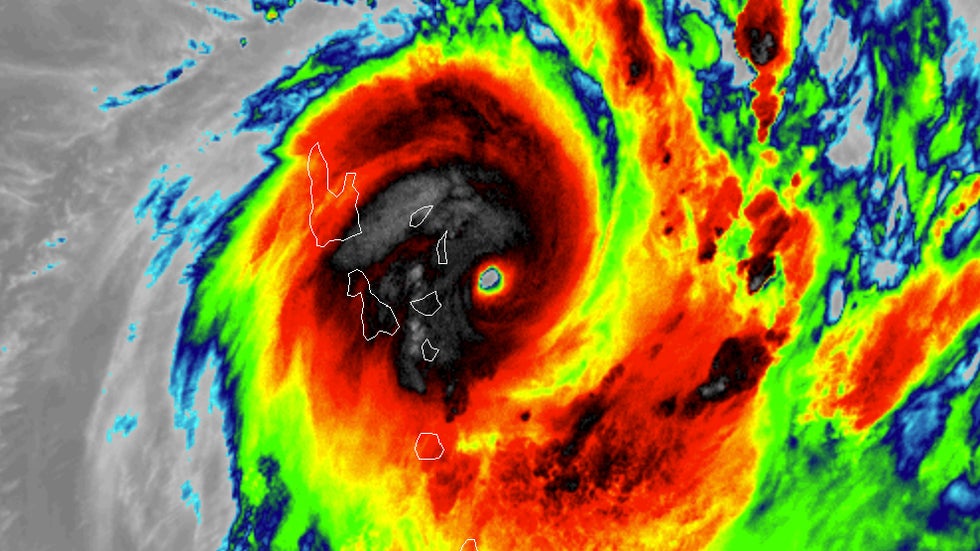
After Harold moved just to the east of Pentecost Island, the JTWC increased the tropical cyclone's winds to 165 mph, making it equivalent in strength to a Category 5 hurricane. This infrared satellite image shows Harold at approximately the same time it was analyzed as a Category 5.
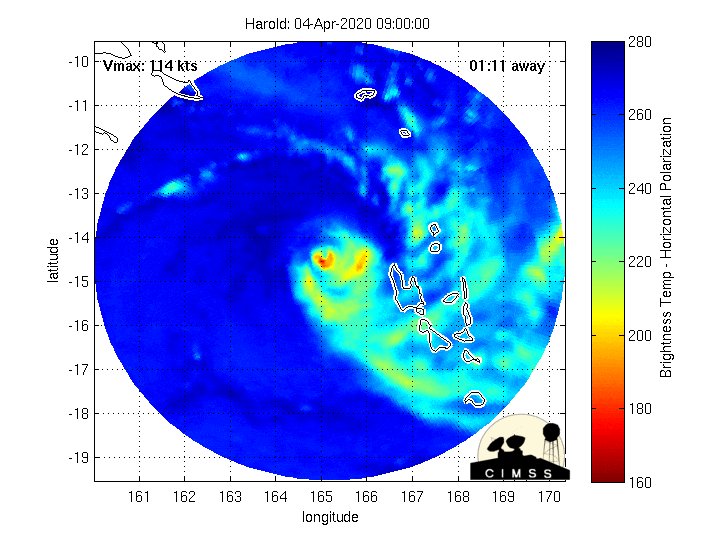
Although no earth-based radar sites were available at the time Harold hit Vanuatu, microwave imagery from satellites can give you a good idea of what the eyewall might have looked like on Doppler radar.
Click the play button below to see microwave imagery of Harold as it approached Vanuatu and slowed to a crawl. You can see how the eyewall became more circular and better defined in the yellow, orange and red shadings as it turned eastward toward Vanuatu.
Cyclone #Harold's approach and trek across #Vanuatu via storm-centered Morphed Integrated Microwave Imagery at CIMSS (MIMIC). tropic.ssec.wisc.edu/real-time/mimt…

23 people are talking about this
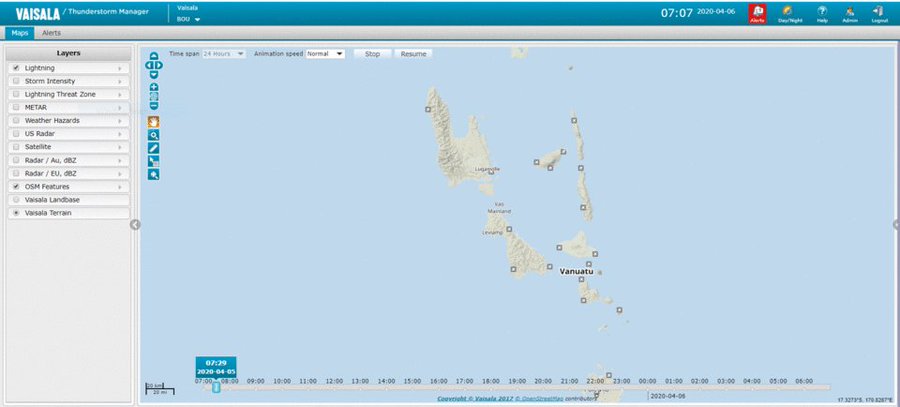
The eyewall was surrounded by an immense amount of lightning activity when it hit Vanuatu, as shown in the 24-hour loop below.
Lightning completely surrounding an eyewall like this is called an Enveloped Eyewall Lightning (EEL) signature, according Chris Vagasky, a meteorologist at Vaisala. Vagasky said in a blog post that EEL signatures are rare and that research is ongoing to better understand what they might mean for tropical cyclone forecasting.

The Weather Company’s primary journalistic mission is to report on breaking weather news, the environment and the importance of science to our lives. This story does not necessarily represent the position of our parent company, IBM.
The Weather Company’s primary journalistic mission is to report on breaking weather news, the environment and the importance of science to our lives. This story does not necessarily represent the position of our parent company, IBM.


No comments:
Post a Comment