Chris Dolce
Climate averages for temperature and precipitation where you live could change next month and are influenced by climate change.
The changes will come as a part of a once-a-decade update by NOAA, which manages such records.
Climate normals are more commonly known as your average temperature and precipitation for any given period of time. They are based on a 30-year period, with 1981-2010 being the most recent dataset in use for comparison.
These so-called 'normals' help put the actual temperature or precipitation into historical context relative to what you would expect in a given time.
For example, New York City's average high and low on May 1 are 67 degrees and 50 degrees, respectively, based on data from the 1981-2010 period. Its overall average temperature (high and low combined) for the entire month of May is 62.4 degrees.
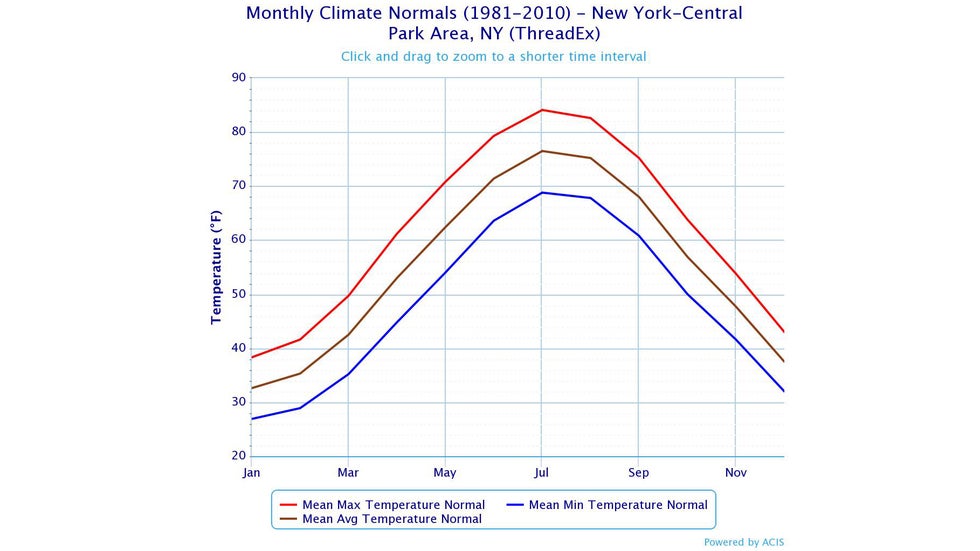 1981-2010 monthly average temperatures using New York City as an example.
NOAA will update normals like these for the United States in May to include the most recent three-decade average: 1991-2020. For many locations, that means there will be an overall increase in the average temperature because of global temperature rise, but there are some caveats.
The map below shows the annual average temperature change in the new 1991-2020 normals when compared to the old dataset that covered the 1981-2010 period. Much of the Lower 48 is expected to have a warmer annual average temperature in the new normals, as depicted by the vast expanse of red shadings.
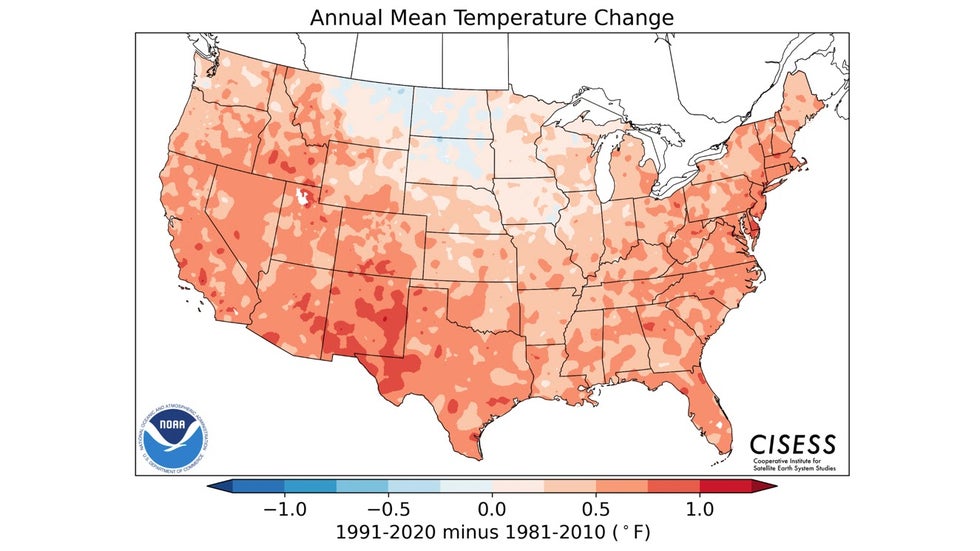 The temperature change, in degrees Fahrenheit, from the previous 30-year normals (1981-2010) to the latest version (1991-2020).
Portions of the north-central U.S. have the least amount of warming in the new normals. In fact, a few spots, particularly in the Dakotas and Montana, will have a slightly cooler annual average temperature in the new dataset.
You can see how the annual average temperature in each 30-year normal period has trended warmer overall throughought the decades when compared to the longer-term 20th-century average (1901-2000).
“The influence of long-term global warming is obvious: the earliest map in the series has the most widespread and darkest blues, and the most recent map has the most widespread and darkest reds," said Rebecca Lindsey in a NOAA climate blog.
That said, this warming influence is not the same magnitude for each region of the country in the 10 different 30-year normal periods for annual average temperature shown in the tweet above.
Lindsey noted, “the pace of warming changes from decade to decade due to other climate influences, both natural and human (think the Dust Bowl and smokestack pollution before the Clean Air Act)."
Annual average precipitation will also be changing for some areas when the new normals are released.
You can see some of the regional trends, particularly a drier Southwest, in the comparison between the 1991-2020 and 1981-2010 normal datasets below. Conversely, annual average precipitation will increase by 5% or more in the new normals for some locations across the north-central and eastern U.S.
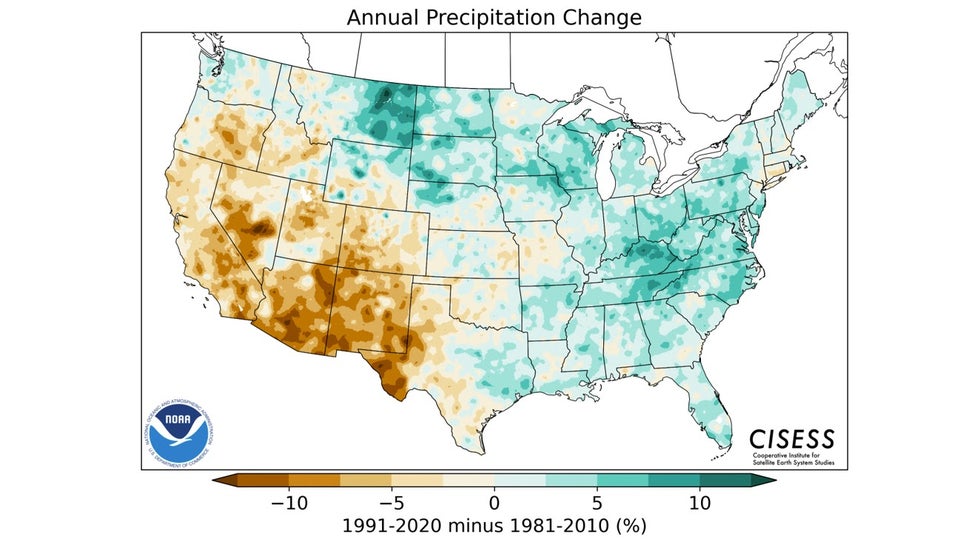 Same as above, but for precipitation change, as a percentage of 1981-2010 average precipitation.
The influence of climate change on precipitation, when compared to the longer-term average (1901-2000) in each normal dataset through the decades, is less clear.
“Few places exhibit a precipitation trend that is either steadily wetter or steadily drier than the 20th-century average. Instead, drier areas and wetter areas shift back and forth without an obvious pattern,” said Lindsey.
That said, global warming is still likely influencing precipitation in the U.S. There is just variability that masks the longer-term expected trends.
“Some parts of the country are projected to see increases in annual average precipitation, and others may see decreases. Some may see wetter winters but drier summers, with little net change in annual average precipitation—but big impacts on natural ecosystems and agriculture that depend on a certain seasonal cycle,” Lindsey added.
The Weather Company’s primary journalistic mission is to report on breaking weather news, the environment and the importance of science to our lives. This story does not necessarily represent the position of our parent company, IBM.
The Weather Company’s primary journalistic mission is to report on breaking weather news, the environment and the importance of science to our lives. This story does not necessarily represent the position of our parent company, IBM.


No comments:
Post a Comment