The 2020 Atlantic hurricane season is predicted to be
more active than usual, according to an outlook released Thursday by the Colorado State University Tropical Meteorology Project.
The group led by
Dr. Phil Klotzbach calls for 16 named storms, eight hurricanes and four major hurricanes. A major hurricane is one that is Category 3 or higher (115-plus-mph winds) on the Saffir-Simpson Hurricane Wind Scale.
This forecast is above the 30-year average (1981 to 2010) of 12 named storms, six hurricanes and three major hurricanes.
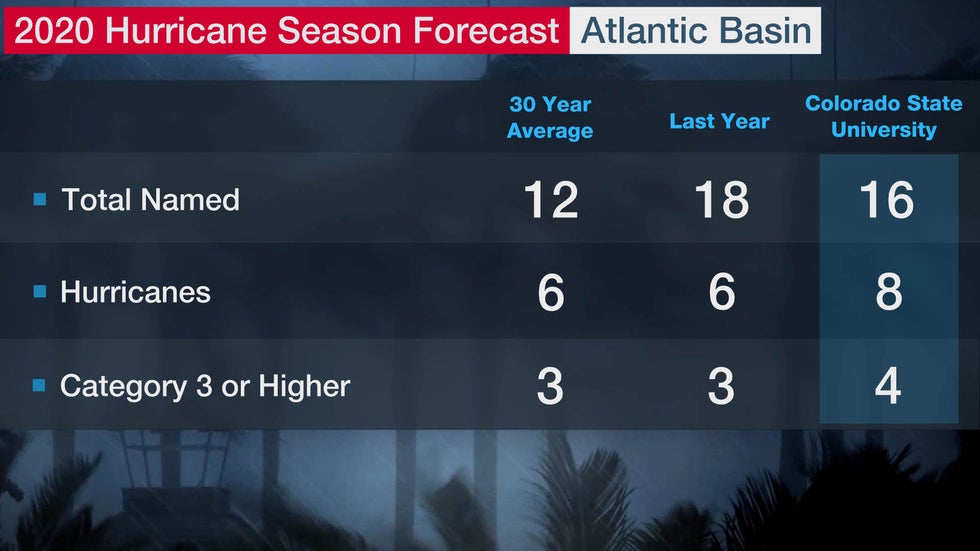 Numbers of Atlantic Basin named storms (those that attain at least tropical or subtropical storm strength), hurricanes and hurricanes of Category 3 or higher intensity forecast by Colorado State University compared to the 30-year average (1981 to 2010) and totals from the 2019 season.
"We anticipate that the 2020 Atlantic Basin hurricane season will have above-normal activity," Klotzbach said.
Though the official Atlantic hurricane season runs from June through November, storms can occasionally develop outside those months, as was the case in the previous three seasons with May 2019's Subtropical Storm Andrea, May 2018's Tropical Storm Alberto and April 2017's Tropical Storm Arlene.
The CSU outlook is based on more than 30 years of statistical factors combined with data from seasons exhibiting similar features of sea-level pressure and sea-surface temperatures in the Atlantic and Eastern Pacific oceans.
Here are some questions and answers about what this outlook means.
What Does This Mean for the United States?
There is no strong correlation between the number of storms or hurricanes and U.S. landfalls in any given season. One or more of the 16 named storms predicted to develop this season could hit the U.S. or none at all. But Klotzbach noted this year could be quite busy for the United States.
"We anticipate an above-average probability for major hurricanes making landfall along the continental United States coastline and in the Caribbean," Klotzbach said. "As is the case with all hurricane seasons, coastal residents are reminded that it only takes one hurricane making landfall to make it an active season for them. They should prepare the same for every season, regardless of how much activity is predicted."
A couple of examples of why you need to be prepared each year occurred in 1992 and 1983.
The 1992 season produced only six named storms and one subtropical storm. However, one of those named storms was Hurricane Andrew, which devastated South Florida as a Category 5 hurricane.
In 1983, there were only four named storms, but one of them was Alicia. The Category 3 hurricane hit the Houston-Galveston area and caused almost as many direct fatalities there as Andrew did in South Florida.
In contrast, the 2010 Atlantic season was quite active, with 19 named storms and 12 hurricanes. Despite the high number of storms that year, not a single hurricane and only one tropical storm made landfall in the United States.
In other words, a season can deliver many storms but have little impact, or deliver few storms and have one or more hitting the U.S. coast with major impact.
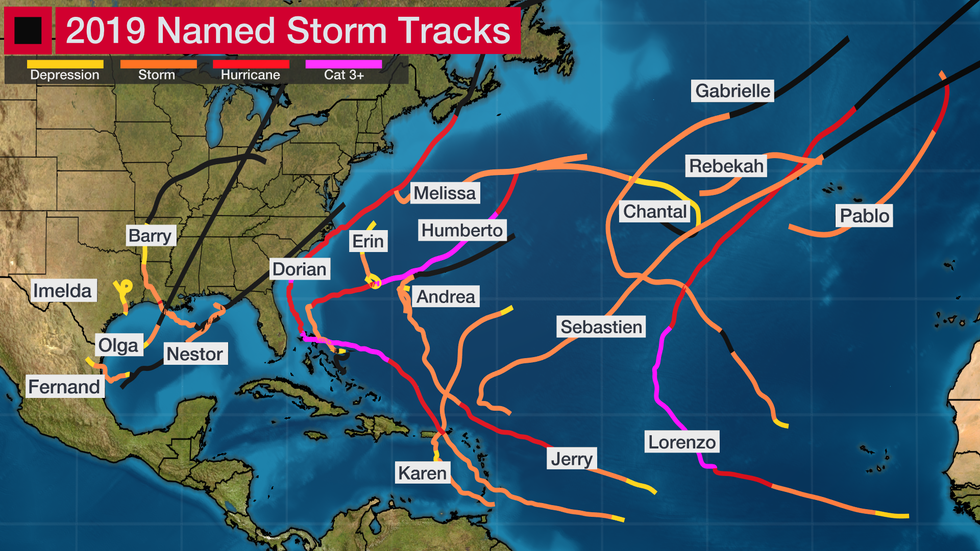 Named storm tracks in the 2019 Atlantic hurricane season. The colors correspond to intensities of each named storm during that section of the track, except for the black sections, which correspond to either a remnant or the time during which a system was a tropical wave before forming into a depression or storm.
The U.S. averages one to two hurricane landfalls each season, according to NOAA's Hurricane Research Division statistics.
In 2019, there were two U.S. hurricane landfalls – Barry in Louisiana and Dorian in North Carolina.
In 2018, four named storms impacted the U.S. coast, most notably hurricanes Florence and Michael within a month of each other.
In 2017, seven named storms impacted the U.S. coast, including Puerto Rico, most notably hurricanes Harvey, Irma and Maria, which battered Texas, Florida and Puerto Rico, respectively.
Before that, the U.S. was on a bit of a lucky streak.
The 10-year running total of U.S. hurricane landfalls from 2006 through 2015 was seven, according to Alex Lamers, a meteorologist at the National Weather Service. This was a record low for any 10-year period dating to 1850, and considerably lower than the average of 17 per 10-year period dating to 1850.
None of the U.S. landfalls from 2006 through 2015 were from major hurricanes.
The bottom line is it's impossible to know for certain if a U.S. hurricane strike will occur this season. Keep in mind that even a weak tropical storm hitting the U.S. can cause major impacts, particularly if it moves slowly and triggers flooding rainfall.
How Much of a Role Will El Niño or La Niña Play?
El Niño/La Niña, the periodic warming/cooling of the equatorial eastern and central Pacific Ocean, can shift weather patterns over a period of months. Its status is always one factor that is considered in hurricane season forecasting.
As of early spring, a weak Modoki El Niño was in place, but waters in March slowly cooled. Klotzbach noted that a transition to neutral (neither El Niño nor La Niña) or potentially even weak La Niña conditions is likely by this summer or fall.
Long-range forecasters at both NOAA and The Weather Company, an IBM Business, were generally in agreement with Klotzbach, suggesting that neutral conditions are anticipated through the first half of the hurricane season (June through August, or JJA), with either neutral or La Niña conditions possible in the second half (September through November, or SON).
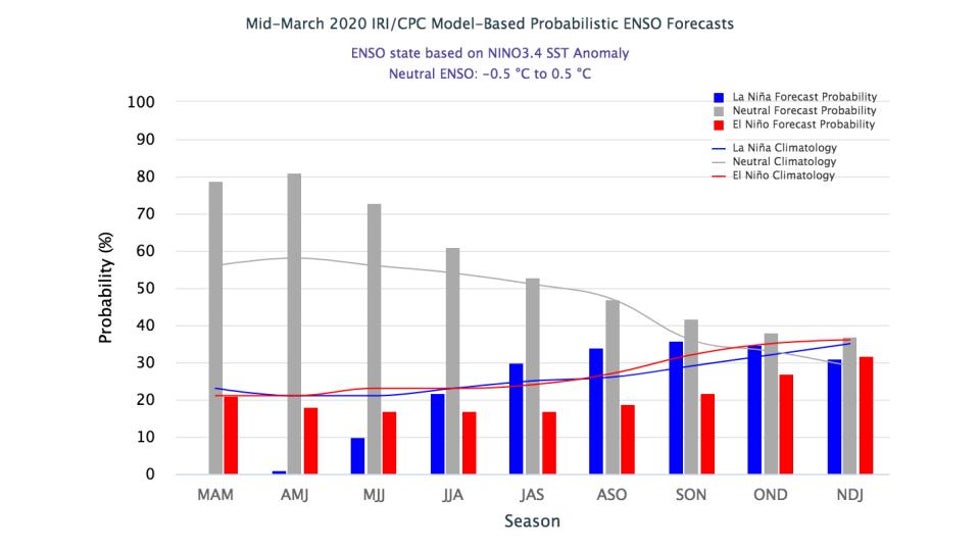 Model-Based El Niño/La Niña Outlook Through the End of the Year
We should note here, before talking about the impacts of a possible La Niña, that the status of the El Niño-Southern Oscillation (ENSO) is notoriously difficult to predict. This is especially true from February to May, when the "
spring predictability barrier" is in play, a period when forecast skill is lower than the rest of the year.
La Niña generally acts as a speed boost to the Atlantic hurricane season, but it is just one factor that can lead to an active year. Hurricane seasons can be active even if La Niña is not in play.
La Niña typically corresponds with a
more active hurricane season because the cooler waters of the Eastern Pacific Ocean end up causing less wind shear along with weaker low-level winds in the Caribbean Sea. La Niña can also enhance rising motion over the Atlantic Basin, making it easier for storms to develop.
The La Niña years of 2010 and 2011 are among several tied for the third-most-active Atlantic seasons on record (both years had 19 named storms). The next La Niña year, 2016, was also quite active, with 15 named storms that included Category 5 Matthew and three other major hurricanes. La Niña conditions recurred midway through the hyperactive and catastrophic 2017 season that produced Harvey, Irma and Maria.
Other Factors in Play
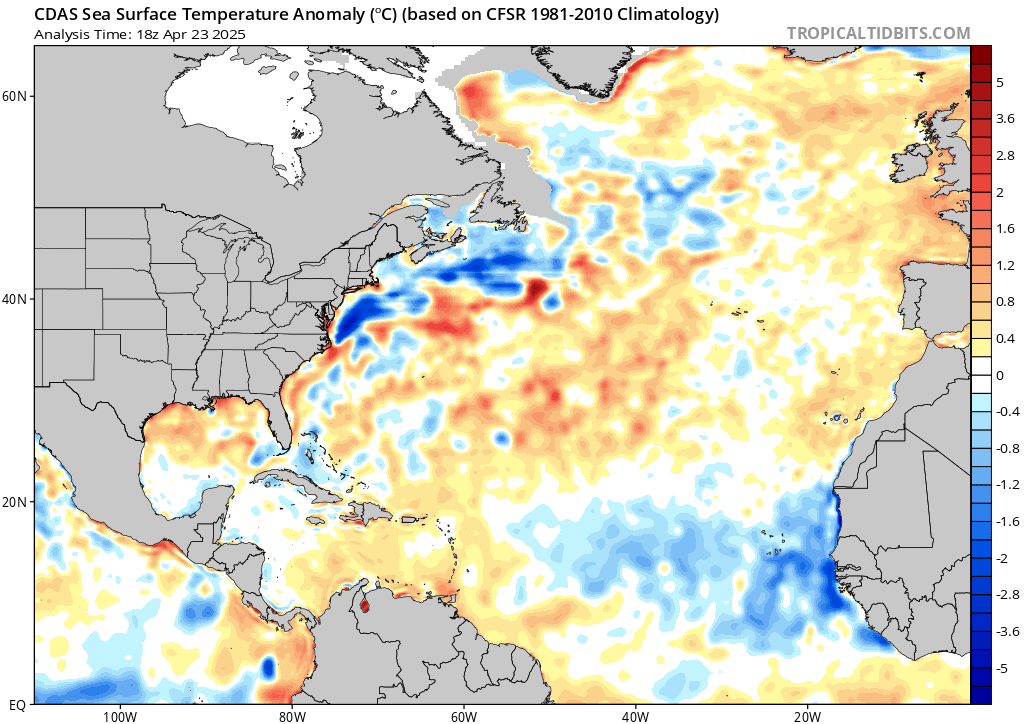
One of the other ingredients that meteorologists, including Klotzbach and the CSU team, are looking at going into the hurricane season is how warm the Atlantic, Caribbean and Gulf of Mexico are.
Much of the Atlantic Basin's waters are already
above average temperature-wise. The Gulf of Mexico is also several degrees above average, given recent heat and the lack of rain over the Southeast.
But it isn't ocean temperatures in April that will help boost or curtail tropical systems. Rather, it is water temperatures during the hurricane season that will do that.
Climate models suggest that most of, if not the entire, basin will be warmer than average in the peak of the hurricane season.
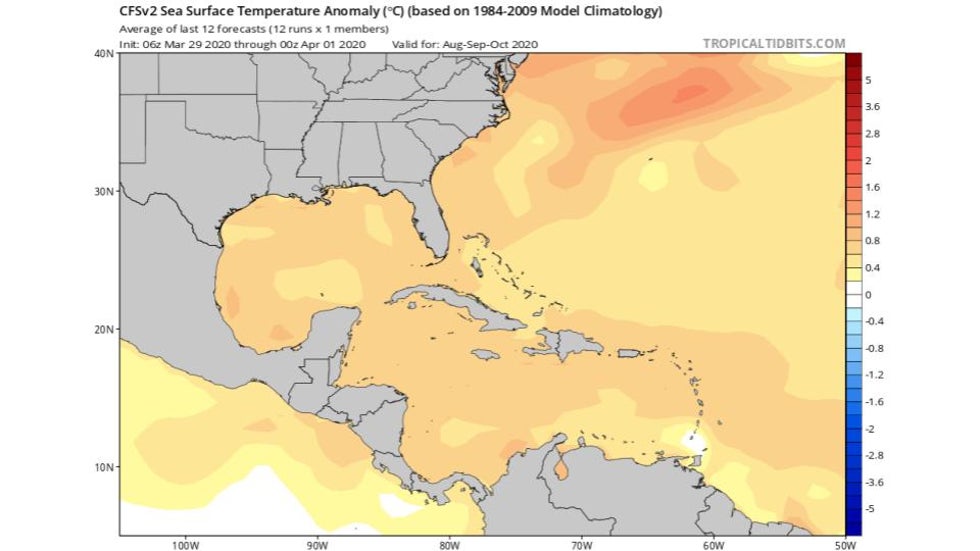 Forecast Water Temperature Anomalies for August through October
An above-average number of tropical storms and hurricanes is more likely if temperatures in the main development region (MDR) between Africa and the Caribbean Sea are warmer than average. Conversely, below-average ocean temperatures can lead to fewer tropical systems than if waters were warmer.
Assuming atmospheric factors are favorable, warmer waters in the MDR allow tropical waves, the formative engines that can eventually become tropical storms, to get closer to the Caribbean and the United States.
The prevalence of wind shear and dry air across the Atlantic will also need to be watched over the next six to eight months.
If La Niña does kick in toward the end of the season, as many forecasters expect, and the atmosphere responds to it, then there could be less wind shear and more favorable conditions for hurricane growth toward the end of the season.
How much dry air rolls off the coast of Africa will also need to be monitored. Even if water temperatures are boiling and there is little wind shear, dry air can still disrupt developing tropical cyclones and even prohibit their birth to begin with.
Hurricanes need a rather precise set of ingredients to come together in order for them to fester, so all of these ingredients will need to be monitored this year.
This was the fourth April outlook issued since the passing of Dr. William Gray, noted hurricane researcher and emeritus professor of atmospheric science at CSU.
Gray, who died in April of 2016, was the creator of the yearly Atlantic hurricane season outlooks, which have been published every year since 1984. He developed the parameters for these outlooks in the late 1960s, which was considered groundbreaking research at that time.
The Weather Company’s primary journalistic mission is to report on breaking weather news, the environment and the importance of science to our lives. This story does not necessarily represent the position of our parent company, IBM.
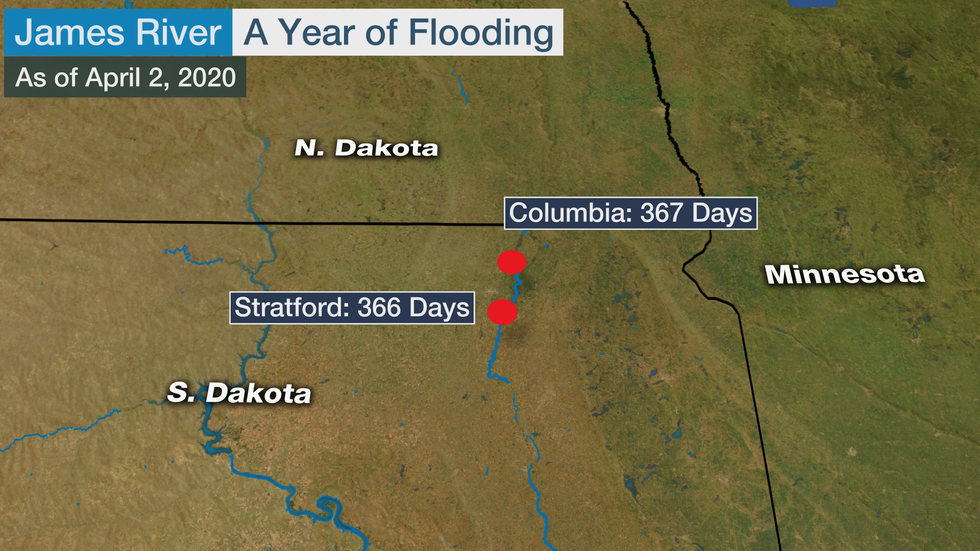 The two river gauges on the James River that have been in flood for more than 365 days. Red dots show where moderate flooding is ongoing.


