Published: May 13, 2021
Summer's heat is just around the corner, and for some locations, 90s are the new normal for at least part of the sweltering season.
Climate normals are more commonly known as the average temperature and precipitation for any given period of time, like a day, month or season. These so-called "normals" help put the actual temperature or precipitation into historical context relative to what's expected at that time.
NOAA updated this normals data earlier in the month to include the most recent three-decade average – 1991 through 2020. For many locations, that means there is an overall increase in temperature when compared to the old 1981-2010 dataset, and some of that is due to climate change.
This recent update also means that some locations now have a maximum daily average high in summer that is 90 degrees or hotter that did not previously in the old 1981-2010 dataset.
You can see these locations scattered from the Southeast into parts of the central Plains and West in the map below created by Jared Rennie, a research meteorologist at N.C. State University's North Carolina Institute for Climate Studies.
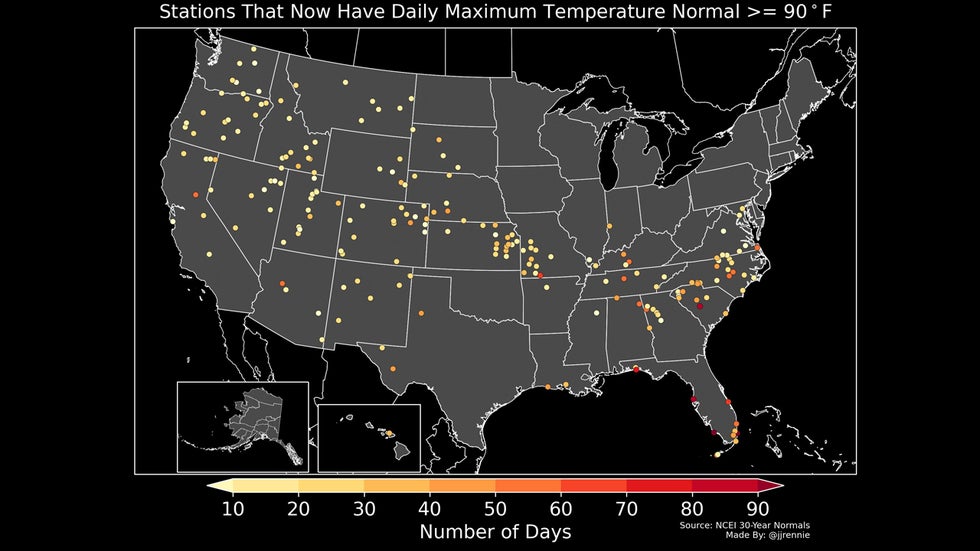 Plotted are the locations that have maximum daily average high in the 90s in the 1991-2020 normals that didn't before in the 1981-2010 normals. The color of each dot shows the number of days the maximum daily average high is in the 90s in the new normals.
One of those locations is Atlanta, where the daily maximum average high in summer topped out at 89.3 degrees in the 1981-2010 normals. The city now has a maximum daily average high in July that is 90.4 degrees.
Washington D.C. had its maximum average high jump to 90 degrees in July for the first time in the new normals. Previously, the maximum daily average high topped out at 89 degrees in the nation's capital.
Topeka, Kansas, and Springfield, Missouri, are two noteworthy locations in the nation's midsection that now have maximum daily average highs of 90 degrees or warmer in the new normals, according to Rennie.
90-Degree Days Increased Last Decade
We can also see how the number of 90 degree days per year has changed in the first two full decades of this century.
Many locations across the Lower 48 had more days in the 90s per year during the most recent decade (2011-20) than the first 10 years of the century (2001-10). This is illustrated with the yellow, orange and red dots in the map below created by Alaska-based climatologist Brian Brettschneider.
This is particularly evident in the southern tier of the nation, where many locations averaged an extra 10 or more days per year in the 90s in the most recent decade.
Brettschneider attributed this change to global and regional temperature increases as well as the effects of urban heat islands.
The Weather Company’s primary journalistic mission is to report on breaking weather news, the environment and the importance of science to our lives. This story does not necessarily represent the position of our parent company, IBM.
The Weather Company’s primary journalistic mission is to report on breaking weather news, the environment and the importance of science to our lives. This story does not necessarily represent the position of our parent company, IBM.


No comments:
Post a Comment