Extremes in temperature and precipitation were on full display in the United States in 2019.
A number of cities were record warm. Others were record wet. One city was both record warm and wet.
With help from the Southeast Regional Climate Center (SERCC) and the National Weather Service, we examined major reporting stations in the U.S. with at least a 60-year period of record without significant missing data to find out which places were the warmest, coolest, wettest and driest in 2019, relative to average conditions.
Since this article was published on New Year's Eve, data is only available through Dec. 30, so some slight adjustment to temperature and precipitation data is possible once the full year's data is finalized.
Surface temperature departures from 1981-2010 average, in degrees Celsius, over North America and adjacent areas in 2019, through Dec. 29, the most recent day the year-to-date analysis was available.
The Warmest
If we listed the warmest cities based on straight temperatures, it would be obvious. Puerto Rico, the U.S. Virgin Islands, Hawaii, South Florida, South Texas and the Desert Southwest would lead the pack every year. Boring, right?
Instead, we examined the anomalies, or departure from average temperatures. The more often temperatures were above average and the higher those departures were above average, the greater the anomaly over the year.
When we did this, Alaska ran away from the rest of the pack in what appeared to be the state's warmest year on record.
America's typically frigid northernmost town stole the national spotlight for abnormal warmth.
The Alaska town of Utqiagvik, formerly known as Barrow, was a whopping 9.3 degrees warmer than average in 2019. Later in this piece, we'll argue another factor made it the nation's most extreme weather city.
Kotzebue, Alaska, came in just behind Utqiagvik with a 9.2-degree temperature anomaly in 2019.
Eleven other Alaska cities were at least 4 degrees warmer than average in 2019, including Anchorage (5.5 degrees warmer) and Fairbanks (5 degrees warmer).
No Lower 48 city had temperature anomalies as dramatic as these Alaska cities. So, to keep our top five U.S. warm cities from being completely dominated by our 49th state, we'll list Utqiagvik as Alaska's representative, followed by the four largest Lower 48 warm anomalies (hence, the asterisk in our table below).
Top U.S. 2019 Warm Temperature Anomalies* (Source: SERCC; *only the top Alaska anomaly is shown)
-Utqiagvik (Barrow), Alaska: +9.3 degrees
-Hatteras, North Carolina: +3.8 degrees
-Meridian, Mississippi: +3.8 degrees
-Atlanta, Georgia: +3.6 degrees
-Charlotte, North Carolina: +3.6 degrees
According to the SERCC and the NWS, 25 U.S. locations with at least 60 years of records tied or set new a record-warm year in 2019. See the tweet below for the complete list.
A number of the cities shown in that tweet have now had most, if not all, of their five warmest years of record in the past few years.
Atlanta and Bristol, Tennessee, have each had their four warmest years all since 2012. Anchorage, Alaska, and Asheville, North Carolina, have each had all five of their warmest years since 2014 and 2012, respectively.
The Coolest
Parts of the Northern Plains and northern Rockies shivered through 2019, chalking up impressive cool anomalies.
Top U.S. 2019 Cool Temperature Anomalies (Source: SERCC)
-Bozeman, Montana: -5.3 degrees
-Rapid City, South Dakota: -4.1 degrees
-Pierre, South Dakota: -3.7 degrees
-Cut Bank, Montana: -3.6 degrees
-Havre, Montana: -3.6 degrees
Bozeman, Montana, had its coldest year since 1993, but not among its five coldest years.
Similarly, downtown Rapid City, South Dakota, had its coldest year since 1996.
The Wettest
Arguably the most widespread and impressive anomalies in the U.S. in 2019 were precipitation.
We counted 45 major U.S. reporting stations with 2019 precipitation surpluses of at least 12 inches from the Northeast through the Tennessee Valley, Mississippi Valley, Great Lakes and Missouri Valley.
Among some of these cities were Memphis, Tennessee (a 20.1-inch surplus), Nashville, Tennessee (17 inches), Tampa, Florida (14.5 inches), Pittsburgh (14.2 inches), St. Louis (13.1 inches), Chicago (12.6 inches) and Newark, New Jersey (12.4 inches).
But we found five even larger wet anomalies.
Top U.S. 2019 Wet Anomalies (Source: SERCC)
-Beaumont-Port Arthur, Texas: +25.19 inches
-Rochester, Minnesota: +22.17 inches
-Tupelo, Mississippi: +22.15 inches
-Fort Smith, Arkansas: +22.12 inches
-Paducah, Kentucky: +21.32 inches
Beaumont-Port Arthur, Texas, topped our list in 2017, largely from Hurricane Harvey's record-smashing rain. In 2019, it was Tropical Storm Imelda's inundating rain that gave the city a terrible case of déjà vu.

Perhaps most shocking about 2019's precipitation was how much some upper Midwest cities pummeled their previous record-wet year.
Rochester, Minnesota, crushed its previous record in 1990 (43.94 inches) by over 11 inches. If a Major League Baseball player topped the current record for home runs in a season (73) by the same percentage that Rochester, Minnesota, topped its previous record-wet year (25.5%), that player would hit 91 home runs in a season.
Rochester's 55-inch yearly precipitation total (rain and melted snow) was wetter than an average year in Orlando (50.71 inches) and Houston (49.77 inches).
Both Green Bay, Wisconsin, and Sioux Falls, South Dakota, set a record-wet year for the second year in a row.
In all, 10 cities in the upper Midwest and Northern Plains had a record-wet year.

Adding to its record-warmest year, Utqiagvik, Alaska, also had its wettest year in 2019, reaching 10 inches of yearly precipitation for the first time in 100 years of records. This was the only city we could find that set both warmest- and wettest-year records in 2019.
Through November, NOAA found 2019 to be the nation's wettest year-to-date in records dating to 1895. NOAA's 2019 full-year recap is due to be released on Jan. 8.
The Driest
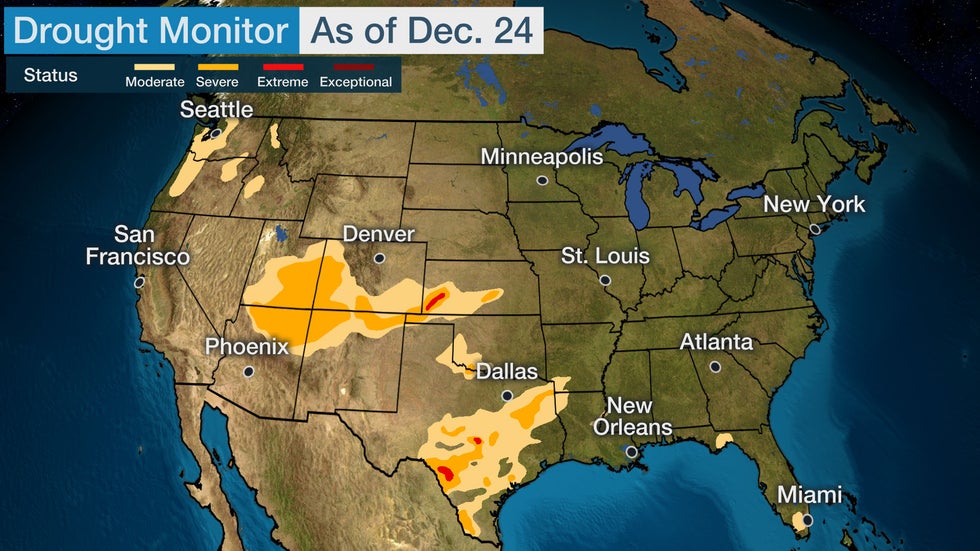
Through much of 2019, there was a "drought of drought" in the Lower 48 states, as we discussed in our 10th strangest weather event of the year.
The top two dry anomalies were in locations that typically are among the wettest in the nation, in Alaska's southeast and along the windward slope of the Big Island of Hawaii.
The Pacific Northwest was another region that was strangely dry. Even with some rain at the end of the year, Hoquiam, Washington, had its second-driest year on record, exceeded only by 1985.
Top U.S. 2019 Dry Anomalies (Source: SERCC)
-Yakutat, Alaska: -46.70 inches
-Hilo, Hawaii: -25.69 inches
-Hoquiam, Washington: -23.80 inches
-Quillayute, Washington: -22.10 inches
-Tallahassee, Florida: -20.06 inches
While most of the drought area was erased by Christmas, some impressive precipitation deficits also were seen along the northern Gulf Coast.
Tallahassee, Florida, had its fifth-driest year on record (39.05 inches), with a 20-inch rainfall deficit.
Florida's capital city was drier than some record-wet upper Midwest cities, including Minneapolis-St. Paul (43.17 inches).

The Weather Company’s primary journalistic mission is to report on breaking weather news, the environment and the importance of science to our lives. This story does not necessarily represent the position of our parent company, IBM.
The Weather Company’s primary journalistic mission is to report on breaking weather news, the environment and the importance of science to our lives. This story does not necessarily represent the position of our parent company, IBM.

No comments:
Post a Comment